
log、metrics、trace是我们观测和监控微服务的三大法宝,而对于metrics,我们尝尝采集服务的指标,把它们推送到Prometheus、InfluxDB等时序数据库中,并使用Grafana展示出来。
如果你有相应的这些基础架构平台,那没有问题。但是如果你缺乏这些基础的监控平台,而且有时候也只是临时想监控一下服务的指标,那么 rpcx 给你提供了一个极简的方法,你只需在rpcx 的服务器添加下面一行:
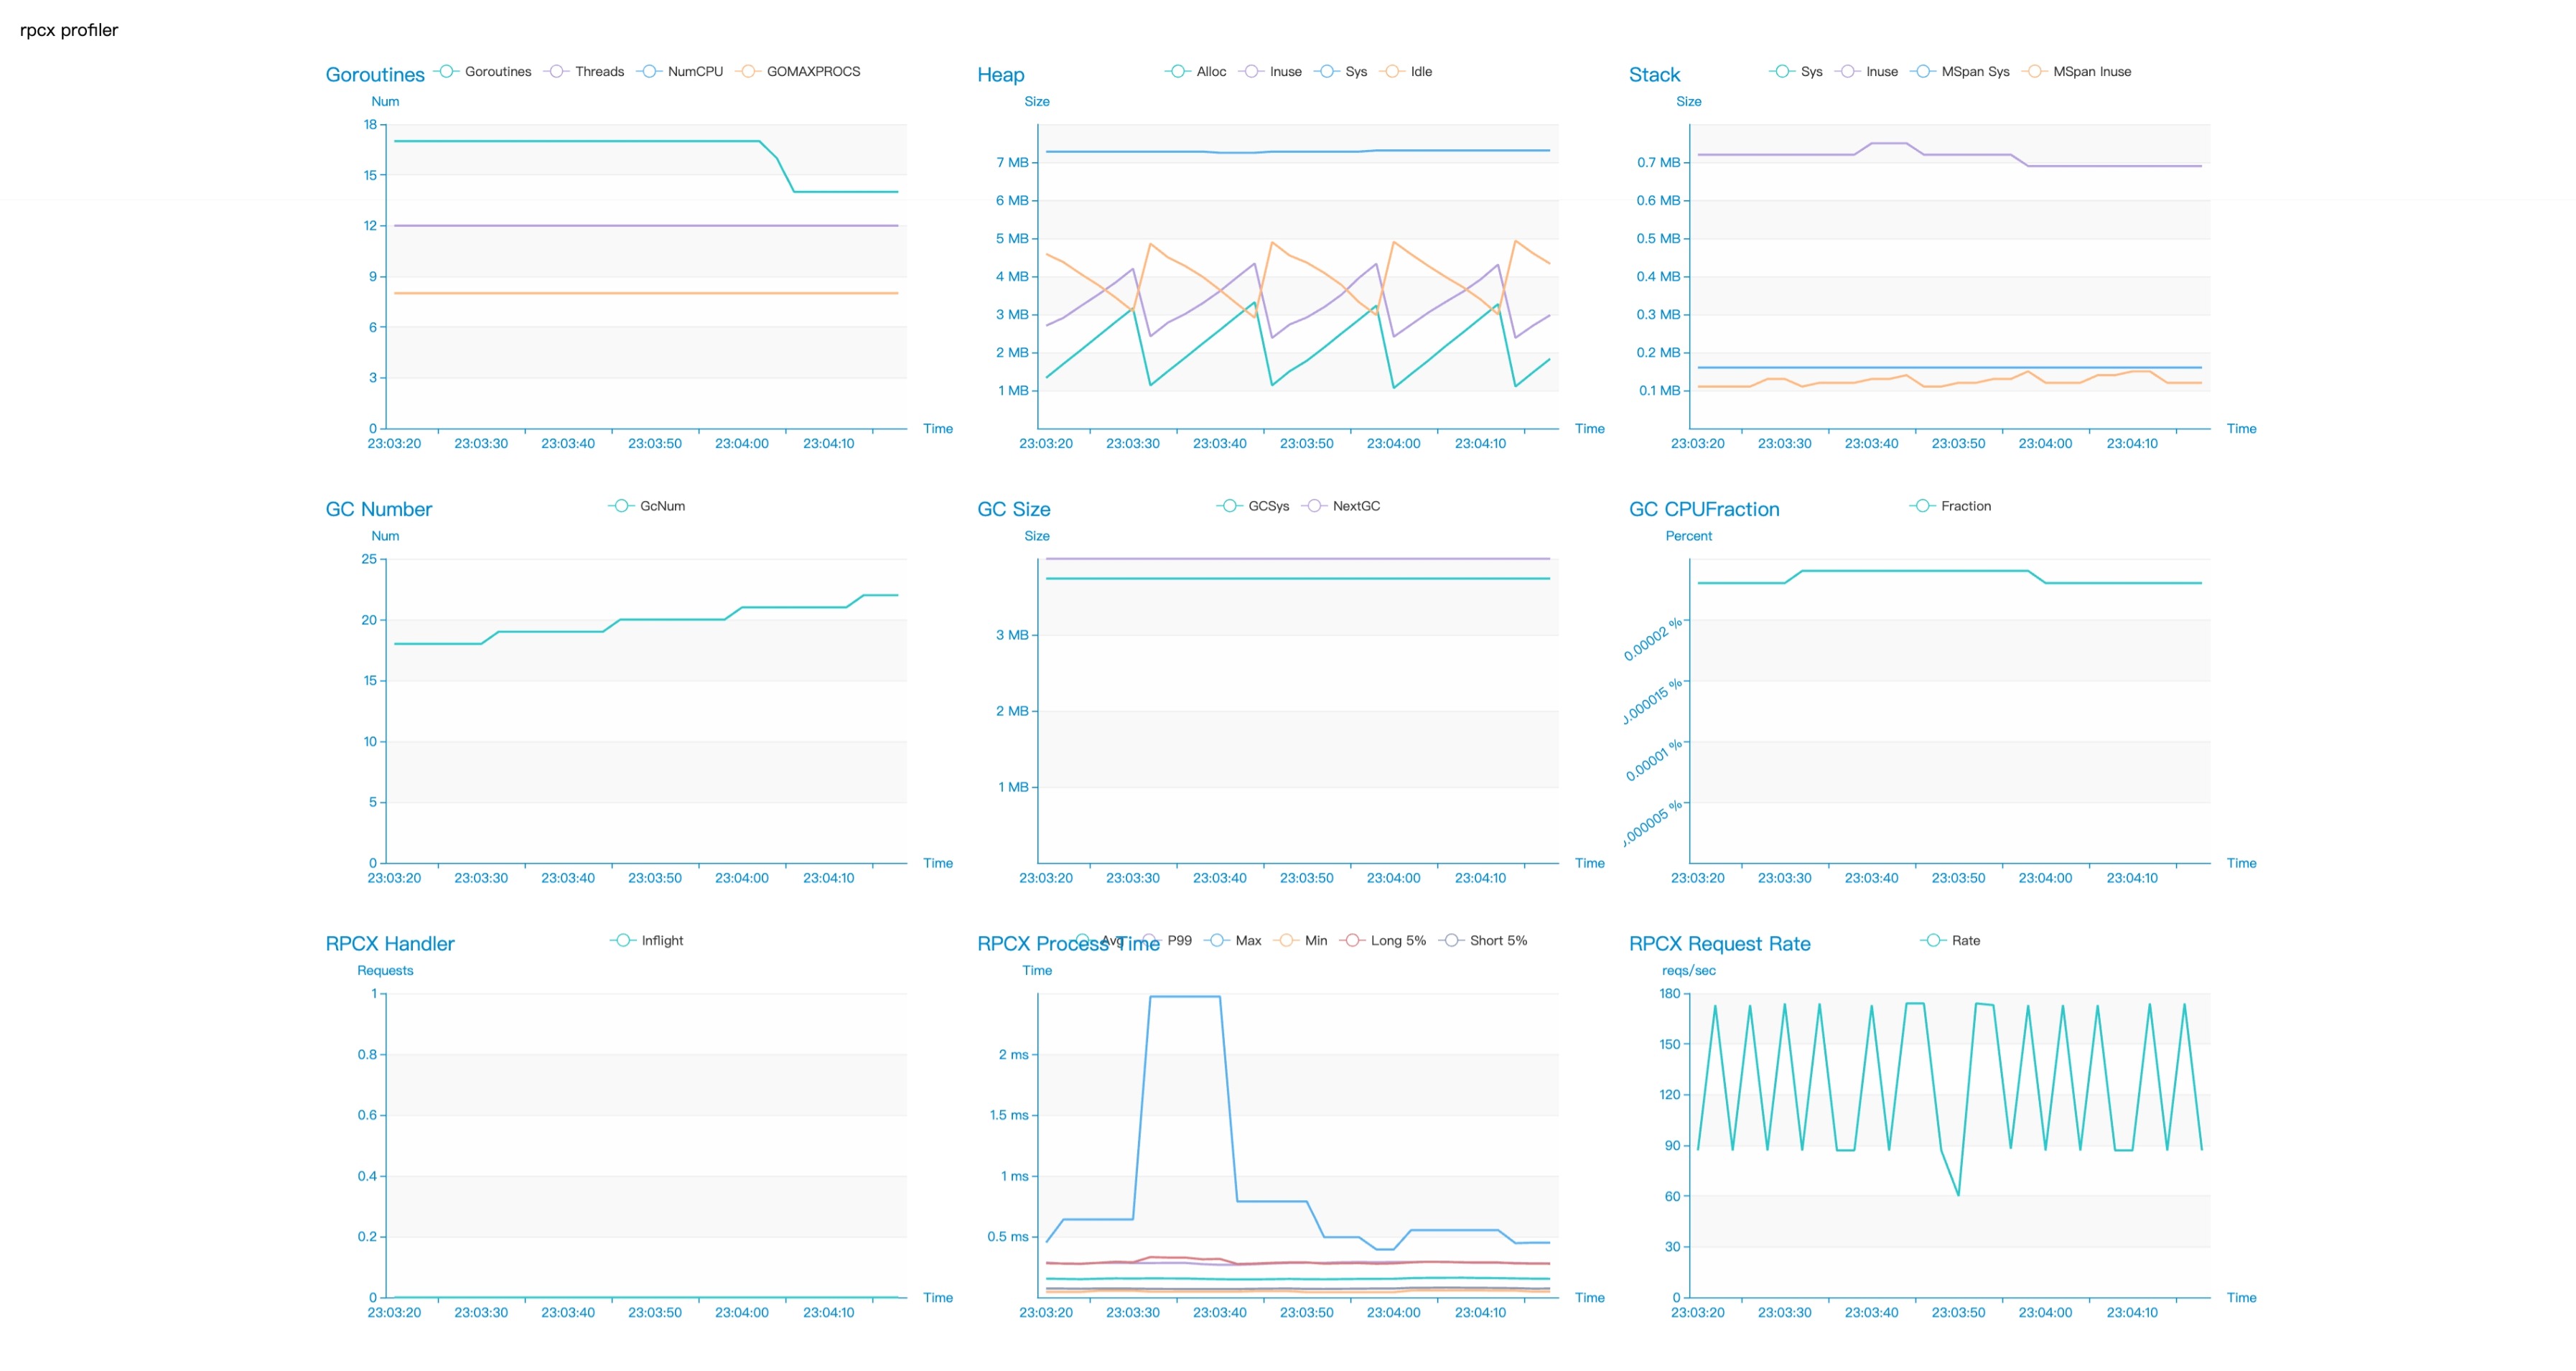
也就是开启Profile模式,就可以可以在浏览器中查看服务基本的指标:
不需要配置监控的服务器地址和端口,不需要配置profile和metric采集,一切都是自动实现的。
那么 rpcx 是怎么实现的呢?
首先,得益于 rpcx 最早在微服务框架中采用的共享端口的方法,我们在服务监听的端口上增加了一个http的服务,支持监控指标的展示,同时也提供了对go profile的 API:
 1
 2
 3
 4
 5
 6
 7
 8
 9
10
11
12
13
14
15
16
17
18
19
20
21
22
23
24
25
26
27
28
29
30
31
32
33
34
|
mux := http.NewServeMux()
	mux.HandleFunc("/debug/pprof/", pprof.Index)
	mux.HandleFunc("/debug/pprof/cmdline", pprof.Cmdline)
	mux.HandleFunc("/debug/pprof/profile", pprof.Profile)
	mux.HandleFunc("/debug/pprof/symbol", pprof.Symbol)
	mux.HandleFunc("/debug/pprof/trace", pprof.Trace)

	for _, v := range mgr.Views {
		page.AddCharts(v.View())
		mux.HandleFunc("/debug/statsview/view/"+v.Name(), v.Serve)
	}

	mux.HandleFunc("/debug/statsview", func(w http.ResponseWriter, _ *http.Request) {
		page.Render(w)
	})

	staticsPrev := "/debug/statsview/statics/"
	mux.HandleFunc(staticsPrev+"echarts.min.js", func(w http.ResponseWriter, _ *http.Request) {
		w.Write([]byte(statics.EchartJS))
	})

	mux.HandleFunc(staticsPrev+"jquery.min.js", func(w http.ResponseWriter, _ *http.Request) {
		w.Write([]byte(statics.JqueryJS))
	})

	mux.HandleFunc(staticsPrev+"themes/westeros.js", func(w http.ResponseWriter, _ *http.Request) {
		w.Write([]byte(statics.WesterosJS))
	})

	mux.HandleFunc(staticsPrev+"themes/macarons.js", func(w http.ResponseWriter, _ *http.Request) {
		w.Write([]byte(statics.MacaronsJS))
	})

	mgr.srv.Handler = cors.AllowAll().Handler(mux)
|
其次,集成go-echarts/statsview这个实时的go运行时profiler,它是基于go-echarts,可以方便的在Go语言中使用echarts绘图框架。
不过这个库两年没有更新维护了,我发现其中的一个bug,也就是Y轴不能显示标签,还有不方便创建自定义的监控视图,所以我fork了一份,方便使用smallnest/statsview。能够在rpcx中快速实现metrics监控的功能主要得益于这个框架。
最后,我们在监控图中增加了最常用的三个指标:
- Handler Inflight - 正在处理的请求数。也就是rpcx服务器接收到,正在处理还没有返回的请求的数量
- 处理时间:最近1000个请求的时间,包括平均时间、最大时间、最小时间、p99等
- QPS:每秒接收到的请求数
而且,基于statsview库,将来我们可以增加更多的监控viewer。